Quantified Content Strategy: Building a Predictive Growth Model for inbound.org
What inputs lead to what goals and outputs in a community like inbound.org?
In this post, I explained our problem with lack of engagement and how we scaled personal email to solicit answers from our members to questions in the inbound.org community.
Whilst we saw quick gains there, and it proved that Q&A could be a content format that would allow us to keep our members engaged and grow, we also hit a ceiling on growth and engagement. It was a tactic not a strategy.
We needed a cohesive strategy to help us grow. And that strategy ties closely to content in our community - particularly the numbers around that content.
Ian Lurie’s argued before that this isn’t the case for most people. Most companies have only a handful of writers. We have tens of thousands. Most companies have dozens or hundreds of posts. We have hundreds of thousands. We’re at the scale where numbers within content can really matter.
This post is about how we quantified our content strategy for the community here at inbound.org, and built a predictive growth model to guide that.
The Power of Cumulative Goal Lines
One of the tools used at HubSpot is cumulative goal charts with current performance plotted against a linear goal line. At a glance, you have a measure of the health of a team - are they above or below their goal line?

Pair this with a goal that increases month-over-month. This masks massive growth goals. An 80% year-on-year growth is possible with just an incremental 5% improvement each month. That’s just doing the same you did last month, plus just a little bit more. It feels achievable! That said, “same old, same old” quickly can’t keep up. You’re forced in innovate to make that next stretch and buy breathing room for the next period.
With a goal line in place, we were forced to innovate in order to keep up. For us on the community team, the number of unique weekly contributors was chosen. More contributors means more content and weekly active users (WAU is our top level metric at inbound.org at the moment). Here’s the graph looks like in context.

How can we grow this community to 1,500 weekly contributors?
Realising that “send lots of email” isn’t a strategy was the first step. All personal emails do (when done right) is bring the right people to the right place at the right time. In searching for a proper community content strategy, we broke this bigger question down into four separate questions:
- Numbers - How many discussions, articles and posts do we need?
- Types - What types of content drive outsized engagement? (i.e. can we short circuit it by showing on more engaging content?)
- Who - Which members should we send what content to?
- What - What topics are trending and worth hosting a discussion around right now?
These each turned into big sets of analysis, so to keep the post reasonable length I’ve divided them into separate posts - the first of which tackles numbers; how many discussions, articles and posts do we need to get to 1,500 unique weekly contributors?
Finding the number of discussions
Community content drives engagement in two ways - members can both contribute content and react to other members content. Sangeet Choudary has a model for this which illustrates “co-creation” within online platforms. For us, increasing the number of contributions (discussions) means we can the environment of content to read and react to.

(Marketplace version of the Unit of Interaction model - adapted from Choudary (platformed.info)
This seems an obvious insight - but that’s not the objective of the model. Can we take this insight and quantify it?
By quantifying this goal, we’ll have a sense of comparison, prediction, be able to build a growth model and design a realistic strategy with our limited resources to reach our goal of 1,500 unique weekly contributors.
First thing is looking for a relationship - a correlation - between the number of discussions and the number of contributors. Does increasing the number of discussions increase the number of contributors?
By plotting a scattergraph, we can see where the data points fall and look for a correlation. And there was! Oh mathematics, you can be so beautiful sometimes :)

We can quantify this relationship by adding a line of best fit (trendline in Google Sheets) which plots an OLS (ordinary-least squares regression) through those points - you can learn more and brush up on regression here at the Khan Academy.
Unique Weekly Contributors = 242 + (2.722 * Number of Discussions)
R2 = 0.745
You can interpret this as 242 people contributing to the community a week without any questions on the site - other articles and posts (anything besides discussions). Then, for every discussion that gets posted, we should see an another 2.7 contributors each week (Note: this model only holds strictly within the data range of 69 to 151 discussions where we have the data points).
Within the given range, we can say that the model explains 77% of the variability (which is high for a model like this) is explained by this equation. (Read more about interpreting R2 values )
We can also look at the average number each week of unique weekly contributors per discussion. This is a much simpler model which doesn’t factor in contributors who haven’t interacted with discussions. It averages 4.7 more unique contributors for every discussion, with a standard deviation of 0.74.

Both of these are relatively strong models within the data range. There aren’t many outliers within either model - it should be useful!
What about articles? Could we still grow with them?
Articles have always been a staple part of the community and what gets shared on inbound.org, but could article sharing be a source of growth for us?
By running similar analysis on articles, we can see the strong correlation between the number of articles shared and the number of unique contributors (excluding shares of articles).

Unique Weekly Contributors = 70 + (0.681 * Number of Articles)
R2 = 0.836
You can interpret this as 70 people coming to the site every week regardless of how many articles are shared, and 7 more unique contributors for every 10 articles shared. The R-squared is very high too at 0.836 (84% of the variation is explained by this equation). This was for between 410 and 641 articles per week.
Under the simpler averages model (which ignores any other reason why members might come to the site), we see 8 unique contributors for every 10 articles shared in the community.

But, these are alarming numbers. Having fewer contributors than posts means most submitters don’t comment or interact with their own post. It also makes the number of articles we’d need to reach our goals become incredibly large.
The OLS regression model says we need 5566 articles submitted every week… which is insane! That’s almost 10x the number of articles submitted already!
Also, it’s questionable there are even 6000 articles about marketing that could be submitted to inbound.org each week, let alone good posts. And that’s still forgetting the problem of 6000 article submissions all competing for attention from our members (an email digest of 6000 links??)
Articles sharing (ergo: sharing knowledge that exists outside the inbound.org community) will always be a core part of the inbound.org experience, but the key lesson here for our strategy is not to rely on articles for driving high levels of engagement and growth - at least before we can figure out how to make members behave and engage with articles as much as discussions.
How many weekly active users from our unique contributors?
With strong models relating unique weekly contributors and discussions, we can build a strategy for the community to hit our goal of 1,500 unique weekly contributors. However, our community team doesn’t exist in isolation. Our overall inbound.org team goal is 15,000 weekly active users by the end of the year.
We count our weekly active users based on any page view by a logged in member in Mixpanel. By pulling this weekly data and comparing it with our weekly unique contributors, we can see that there’s a consistent trend associating contributors and weekly active users.

Weekly Active Users = 2260 + (3.9 * Unique Weekly Contributors)
R2 = 0.704
This chart means a base level of 2250 members coming to the community each week anyway (regardless of the number of contributors - to browse, to use other parts of the website like the jobs board, and so on), and 4 more for each new unique contributor. (Note: this only strictly holds within the sample range of around 400-700 weekly contributors). Again, the correlation is strong with an R2 of 0.704 - 70% of the variation is explained by that equation.
Using the simpler averages model (which doesn’t account for contributors who have participated in anything else on the site) we see 7.5 more weekly active users for every extra unique weekly contributor, with a standard deviation of 0.91.

Comparing the OLS and Mean Average models
With more discussions (and articles) resulting in more contributors, and more contributors resulting in more weekly active users, we can model how many discussions and contributors we need to reach our end-of-year target of 15,000 weekly active users.
But, does increasing the number of questions have any effect on the number of contributors? Predictive models like this aren’t perfect. Whilst the correlations are strong and shows it’s a good model, we’d want to see if it holds a similarly strong correlation outside the data range (i.e. with even more questions and contributors than we’ve had before).
Is the model likely to change with more discussions?
The 2nd commenter indicates a discussion - “it takes two to tango”. By looking at the time it takes for a discussion to get to 2+ commenters, we noticed a trend showing more questions develop into a “discussion” (2+ commenters)
This was with both the number of questions and the number of contributors. More activity seems to correlate with faster activity.
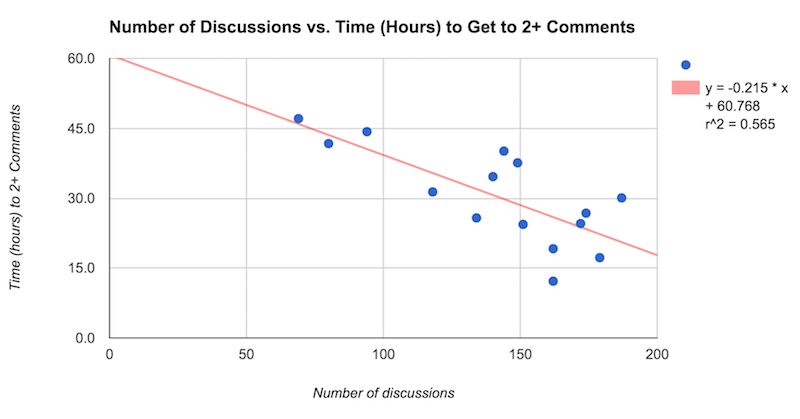
Average number of hours to 2+ comments = 66 - (0.057 * number of contributors)
R2 = 0.39

CHANGE THESE NUMBERS
Average number of hours to 2+ comments = XXX - (XXX * number of discussions)
R2 = XXX
For every extra contributor, it appears to shave off an average of 3 minutes 26 seconds (0.057 hours) the time it takes to get an answer (within the data range of 400-800 unique contributors). There’s still a positive correlation (although not as strong) to show more activity creates faster activity.
So far as our model earlier, we can probably expect discussions and contributors to be lower than predicted. We’ve some evidence to show more activity speeds up activity overall.
But, it’s still very clear from this analysis that questions are the way forward, supplemented by articles, and that we still need to substantially increase the numbers of discussions which get posted in order to meet our overall team goal.
Can we test this? (And build our case with the product team?)
A mathematical model built from our own data might be helpful for drawing an insight, but it isn’t useful on it’s own for predicting the future. Does the model hold outside the existing data range?
The test we need to run is simply to surge the number of questions beyond our existing data points - with brute force or otherwise - and see if the resulting numbers of contributors and weekly active users matched what our models would predict. The week of the 9th May, we did exactly that.
This was done all on the marketing team without product team involvement. Some of the techniques we tried:
- Answering more questions posted (being less selective in questions which we didn’t run our outreach process on).
- Re-posting old questions which weren’t answered (we reset the date of the submissions, and email the original poster to let them know. We’d sometimes tweak the titles and posts for clarity too)
- Posting our own questions (particularly those designed for high engagement, or targeting contributors in inactive segments).
- Sharing more CTAs, posts and emails prompting people to ask questions
With each of these, we ran our Q&A outreach playbook which involves clarifying and cleaning up the submissions, reaching out to relevant members, and upvoting the post and good comments. All of this wasn’t stuff we’d be able to sustain as a marketing team without forgoing other activities we work on week-to-week, since the outreach process is piecemeal. Twice the questions is twice the work.
The results? We reached 188 discussions (48 above our average), 741 unique contributors and 6476 weekly active users. Here’s what each of the models say.
[ Table: Surge Week sheet ]


The OLS model significantly underestimated the number of weekly active users, and the mean average model significantly overestimated the number of weekly contributors. But, the overall result we saw was in line with both models. Increasing the number of questions led to appropriately proportional increases in contributors and weekly active users.
Accordingly, our models predict the following:
- OLS Model requires 1329 discussions and 3860 unique contributors
- Mean Average Model requires 439 discussions and 2001 contributors.
Both models don’t factor in other variables (like contributions to articles), so the Mean Averages is likely to be an under-estimate, and the OLS Model an overestimate. By rounding these to the nearest, neatest thousand #RoundNumberSyndrome (approximately 0.6 weighting between the two models), we should target approximately 1000 weekly discussions and 3000 weekly contributors.
What the surge week test also did was strain our team considerably - our community processes creaked when we scaled this up. Central to this was the need to use personal emails to get the right people to the right questions at the right time. As piecework, increasing the number of questions we run outreach on leads to a proportional increase in workload. It’s okay for a test, but not for building a sustainable strategy for growing the community.
With this, we can design ideas to approach our product team with. By presenting the problem, the tests, some ideas for solutions and how this ties directly to our teams fundamental objectives (remember the exponential goal lines earlier?), we can see this initiative prioritised higher in our development queue.
How could we grow the number of questions asked?
This really falls on two sides - product side, and marketing side. Product side is far more scalable and relieves our marketing team for other projects, but has an extensive backlog (and with it a need to “make the case” for development time). Marketing side is limited mostly by hours available to contribute (we’re a small team).
Most of these ideas fell into five buckets for growing Q&A, and wider discussions in the community.
1. Growing general awareness of Q&A
To make all visitors and members aware of they can ask a question to the community, we can grow general awareness with CTAs across the site.
We have a submission button in our top nav bar, but we don’t really have much space for clearer, more focused calls to action about asking questions. So we’ve a sidebar call to action matching the rest of the site’s clean design.
There’s also calls to action to add on each of the discussion pages and creating welcome guides for new and inactive members that prompt members to post questions.
None of these are particularly intrusive, but raise awareness that this is something you can do.
2. Capturing intent
When our members show more explicit signals of intent, we can send more explicit messages and calls to action to post.
Searching the site show’s a similar behaviour to asking a question - by creating a big “Search or Ask a Question”. You'll see this now at the top of the site.
Also, by using events and page views around searching or asking a question to send members’ emails prompting them to post a question (similar to abandoned cart emails on shopping sites).
Potentially, we could look at offsite signals of intent and target members (and non-members) with ads and landing pages to drive.
3. Producing more ‘accessible’ content
Some types of threads do a much better job at soliciting questions than others (how we do that is a topic for a whole other post) - in particular, AMAs and clinics:
Clinics are topical threads where members can ask questions around a related subject and have answers within the thread - this concentrates activity. We’ve tried various formats of this, but in the end settled on a thread style similar to our “Ask Us Anything” threads previously. There’s two key differences here:
- It manages social density. By aggregating activity in one place (and time), members helping and being helped are concentrated in one thread. This lowers the barrier to posting, increases the belief that questions will be answered, and increases engagement.
- It brings questions into existing conversations - instead of starting new ones. It’s more difficult to do something new, than join in with something that exists already - especially if what already exists is very popular.
4. Turn Articles into more “Discussions”
Discussions get more clicks, views and engagement. Similarly, article previews with custom descriptions get significantly more engagement too. We actually used our own findings as data on our article submission form to encourage members to share custom previews. “Pro Tip: Write a summary! Links with custom summaries in 2015 had +34% upvotes, +57% comments and +55% clicks through.”
To encourage article sharing to function more like discussions, we need to encourage more freeform comments. Facebook, LinkedIn, Twitter and others have a free-form text field for all sharing where the links get parsed and presented separately. This encourages members to share some sort of commentary or original thought, which invites more conversation.
5. Self-governance
As communities grow, it becomes impossible for a community management team to grow and manage all these relationships. Instead, community managers’ roles pivot to helping members’ own initiatives (members starting new groups, starting threads, hosting events) which scales the impact they can have.
At inbound.org, we’re reaching the scale where there’s too much activity for a small team to manage well. We’ve also seen plenty of grassroots initiatives where members are creating their own communities, habits and patterns on inbound.org. These are opportunities for inbound.org to grow engagement significantly.
The community team’s role needs to pivot to nurturing those activities which produce more activity themselves. This will let us grow the number of contributors (and therefore weekly active users) without having to scale our own team significantly. All whilst building a stronger and tightly-knit community.
I’d love to hear your thoughts and ideas for encouraging people to post questions on inbound.org in the comments!
Our product team backlog is extensive. The insight alone that the number of questions drives growth is not enough to become a priority.
What about contributors?
The other side of the numbers in the community is the number of members who can visit and contribute to the community. We class a contributor as any member who has posted 2 or more comments, or has ever shared a new submission in the community.
Members in the site follow two paths:
- Path to becoming a full member and contributor
- Retention cycle (new, active, fading away, lost)
Both of these need to be considered and understood in order to growth the number of contributors and weekly active users. Whilst we’ve been lucky with member acquisition (we’ve over 165,000 at the time of writing), we’ve struggled retaining members.
Only 30% of our members complete their profiles. Of our contributors however, most of them (77%) have a completed profile. There’s likely some relationship here between profile completion and become a contributor. Whether it gives us more information to include them in outreach emails, or they’ve previously contributed and want to have a profile which showcases them better - this needs more analysis (I suspect it’s a bit of both).
Even if the relationship works the other way, populating profiles gives us more targeting info and more chances to include them in our tightly-segmented outreach emails.
We grow our pool of contributors by 400-500 members per month. This puts us on track for around 19,000 by the end of the year. To reach our target of 3000 weekly contributors, we need these to contribute (on average) once every six weeks, although that distribution is unlikely be equal.
Currently, just under 8% of our contributors actively contribute each week. We need to double this to reach our target.
We can also grow our pool of contributors through member acquisition and profile completion - members with completed profiles are 145% more likely to become contributors. There’s a tradeoff though in asking for this information early on though. New members arriving with an existing intention - “I want to comment on this”, “I want to apply for a job”, - don’t want to spend time filling out a profile. That doesn’t feel like it adds value. Instead, we try to progressively profile our members over time, whilst encouraging them to build habits of consuming and contributing content in the community.
The Growth Model
From discussions, members, contributors and more we can produce a simple model relating them all. This uses the OLS models for contributors and weekly active users.

By building this model, we’ve also an understanding of areas for optimising. There’s some clear gaps to address, notably around profile completion and retaining activity amongst our contributors to keep questions being posted.
Together, this can inform our product and marketing strategy and guide us towards our goal. We can also use this to understand where and why we do (or don’t) hit our goal, so we can continue to improve in future.
So what?
You grow a community by increasing the number of discussions. Not really rocket science? It’s a fairly obvious result.
The process though of getting there, and informing the decisions. Also, by quantifying this with models, we can model what improvements we need to make to reach our targets. Remember the power of exponential goal lines.
inbound.org isn’t like a traditional SaaS product, e-Commerce store or something with more - this may feel like overkill for you. Our community produces our content which is our product.
There’s lessons here in understanding and modelling your own growth - using regression models, creating brute force tests (scale things that don’t scale), and creating a compelling case for your product team. Perhaps most importantly and widely applicable - the need to have your data all available and accessible. Your marketing is only as good as your data.
Questions? Ideas? I’d love to hear your thoughts in the comment thread on inbound.org